Running a business means staying on top of a lot of different tasks. In order to be successful, you need to be able to wear many hats and handle a variety of different responsibilities. This can include anything from bookkeeping and accounting to marketing and sales. It’s also important to be organized and efficient and to be able to stay focused on your goals. If you’re prepared to work hard and put in the time and effort, then there’s no limit to what you can achieve.
There are many tools that can help business owners and employees ensure that certain tasks and projects get completed on time, but one particularly effective tool is the Gantt chart. Keep reading to learn more about Gantt charts and how they can be useful for your business.
Also read: Top 10 Tools For Project Planning And Management For Freelancers
What is a Gantt chart?
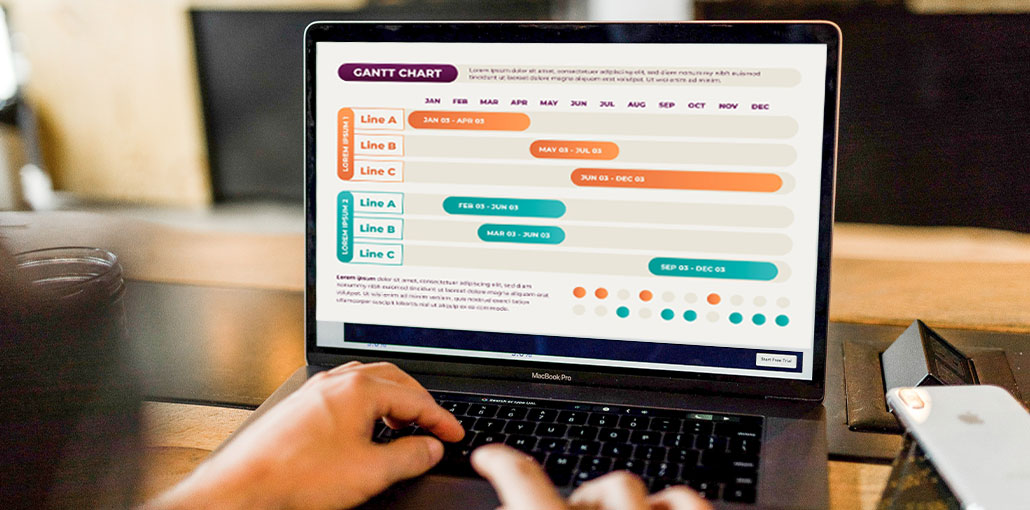
A Gantt chart is a type of bar chart that illustrates a project schedule, named after its inventor, Henry Gantt. It is a graphical tool that shows the relationship between tasks and their duration. The horizontal axis of the chart shows the time scale while the vertical axis shows the different tasks that need to be completed. Each task is represented by a bar, with the bar length proportional to the duration of the task. The start and finish dates for each task are also shown.
A Gantt chart timeline is a great way to track the progress of your project and ensure that all tasks are completed on time. It can also be used to identify any potential delays or problems that may occur. By using a Gantt chart, businesses can visualize the different tasks that need to be completed in order to achieve their goals and how those tasks are related to each other.
How can businesses use Gantt charts?
There are a variety of different ways businesses can use Gantt charts to help with project management. One common way is to use Gantt charts to track tasks and milestones. This can help ensure that projects are completed on time and on budget.
Gantt charts can also be used to help with resource allocation. By tracking the availability of resources and plotting the tasks that need to be completed, businesses can ensure that everyone is working on the most important tasks at the right time.
Gantt charts can also be helpful for scheduling and forecasting. By plotting out future tasks and dependencies, businesses can get a better idea of how long a project is likely to take and what resources will be needed.
Finally, businesses can also use Gantt charts to create a project plan. A project plan can include a summary of the project, the objectives, the steps, and the resources required. Additionally, the project plan can include a schedule and budget for the project.
Also read: Pros and Cons of Flowcharts
How do you create a Gantt chart?
There are a variety of different software programs that allow you to create a Gantt chart. Microsoft Project is one such program. It is a software application that allows you to create project plans and track their progress. The Gantt chart is a visual representation of the project plan that shows the start and finish dates of the tasks as well as their duration.
To create a Gantt chart in Microsoft Project, you first need to create a project plan. The project plan will include the tasks that need to be completed as well as their start and finish dates. Once the project plan is complete, you can create the Gantt chart by opening the View tab and clicking on the Gantt Chart button. The Gantt chart will then be displayed, and you can move the tasks around on the chart to change their order. You can also add dependencies between tasks by clicking on the arrow between the two tasks.
When creating a Gantt chart, there are a few best practices to keep in mind in order to ensure its accuracy and usefulness. Start by creating a list of all the tasks that need to be completed in order to achieve your goal. This could include anything from writing a report to launching a new product.
Next, determine the start and end dates for each task, then create a Gantt chart using a software program or online tool and input the data from your list. Once the chart is complete, review it to ensure that the tasks are in the right order and that the start and end dates are correct. As the project progresses, update the Gantt chart to reflect the actual progress and celebrate milestones along the way.
Overall, Gantt charts provide a detailed view of the project schedule and can help you stay organized while completing certain tasks.


Leave a comment